
Pembroke Pines asked for the truth, not a testimonial. The city commissioned PCG to put the question to residents directly, with a scientific survey built to hold up to scrutiny.
The short version: the second wave asked about a proposed $80 million public-safety bond twice, once cold and once after a short factual briefing. Support went from 27% to 42%. Days later, the bond stayed off the November ballot.
What the city needed
A representative measure of how residents rate city services, at a sample size large enough to model every district with confidence.
A handful of voices, amplified. Social media and public comment are real signals, but they measure volume, not the community.
2,876 residents, weighted to match the city by age, gender, race, party, and district. Every neighborhood in the read.
What we did
PCG designed and fielded a 17-question community survey from July 6–9, 2026, then matched every response to one of the city’s four City Commission districts. 1,933 residents answered. We weighted results to the city’s active registered voters, producing modeled estimates with a ±2.9-point band, not raw counts. The frame is the electorate, not the Census population, and we say so plainly. We suppress small bases, publish the bands beside the numbers, and de-identify every response before anything goes live.
We committed to 600 responses per survey, 1,200 in all. Across both waves we closed at 3,569, nearly three times the minimum. More voices, tighter margins, and far more confidence in every finding.
What residents told us
The first wave found a city that is largely working.
Every measure is reported with its full split. A score is not a grade, and the neutral middle is part of the story. The goal wasn’t a headline number; it was a clear, defensible picture the city could act on.
Residents also wrote. The first wave returned 1,938 substantive written comments, 884 on what the city does well and 1,054 on what to improve. We reviewed every one and published them beside the numbers.
Then a decision to test
The findings didn’t sit still. About two weeks after the first wave closed, PCG went back to the same electorate from July 21–24, 2026 with a second wave built around a specific choice in front of the city: a proposed $80 million public-safety bond.
1,636 residents answered, with a ±3.4-point modeled band. And 693 of them had taken the first wave as well. In a month when nothing compelled them to participate, more than four in ten came back. Residents do not do that unless they think it matters. The second wave also went deeper on transit, code enforcement, and how the city communicates: 82% of residents said they were likely to sign up for city text alerts and 48% would use a free on-demand ride service, each asked of about 1,400 residents.
What happens when residents are informed
The second wave asked the bond question twice: once cold, then again after a short factual briefing on what the bond would fund and what it would cost. Between the two asks, support moved 15 points.
Support for the proposed $80M public-safety bond
n = 1,605
n = 1,396
This is information, not advocacy. The briefing was factual, and the survey did not test persuasion. And 42% is still short of a majority, with 34% opposed. Plainly, the number moves when residents know what they are being asked to fund.
A city can work with that. It says less about whether residents support the bond today than about what they know, and it points directly at what the city would need to do before asking.
The decision it informed
The research reached the Commission before the decision, not after. Evan Ross presented both waves at the Commission’s meeting on August 5, 2026. Later in that same meeting, the motion to put the bond on November’s ballot died for lack of a second.
The numbers in front of them were specific. We found two hard limits on support, and more residents preferred a bond for drainage and flood prevention than for the public-safety complex.
The survey was not the only factor, and we would not claim otherwise. Mayor Angelo Castillo said he had doubts about the bond almost right away, and that competing questions on the same November ballot made the timing wrong. What he credited the research with was confirming his read. The community survey, he said, “helped to solidify where I’m at.”
That is the job. PCG does not make ballot decisions for a city. What we do is make sure the decision gets made with the electorate’s actual position on the table. A question that opens at 27% and tops out at 42% is a question that needs work before it needs a ballot, and Pembroke Pines now knows what that work is.
Built to be used, not filed away
Most survey work ends as a PDF in an inbox. PCG delivered both waves as a live, interactive dashboard: an explorable map, a side-by-side comparison of all four districts, every question from both surveys, and residents’ own written comments. Leadership can interrogate the data themselves rather than take our word for it. So can anyone else: the study sits in our public research library.
The dashboard did not stop at city hall. Residents got the same view their leaders had, on any question, in any district. The city links to it from its own community survey page, so people find it where they would think to look. A method that is stated in public is a method that survives being questioned in public.
The coverage it earned
A survey a city can use is also a survey the press can write about. Within a day of the August 5 presentation, the results drew three stories across two outlets: the city’s local paper, twice, and the statewide political press. Every one of them named PCG as the pollster.
The reporting included the findings least flattering to the city, and the bond’s fate led one story outright. Florida Politics described the published results as “a remarkably interactive and cross-tabulated dashboard.” Earned media looks like this when the work underneath it holds: the press did not need our framing, because the numbers were public and the method was stated.
 Featured coverage

In their words
Knowing what our residents think is critical in our ability to deliver the results they want. The research conducted by PCG allows us to create a blueprint to address not just the loudest voices, but all of the voices in our city. This is one of the best investments we’ve made in my 20-plus years in office and the single most impressive presentation of data I have ever seen.
 Angelo CastilloMayor · City of Pembroke Pines
I’ve worked for a world-renowned pollster and traveled the globe doing public opinion research. I’ve never seen a better or more useful presentation of data than what PCG delivered to Pembroke Pines.
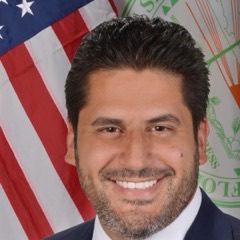 Michael HernandezVice Mayor · City of Pembroke Pines
PCG made a complicated process and complicated data easy. Our department directors raved about how the dashboard provided them with insights into the data. The newfound level of understanding of what the public thinks and wants is helping us better serve our residents.
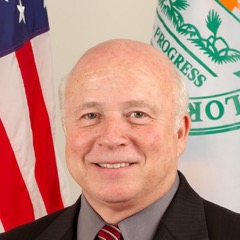 Charlie DodgeCity Manager · City of Pembroke Pines
Public Communicators Group made the complex world of polling easy to navigate. Their expertise and responsiveness helped us develop unbiased questions and clearly communicate the results. The interactive dashboard they created was second to none—easy to use, visually engaging, and incredibly effective at presenting the data. They were a tremendous partner throughout the entire process.
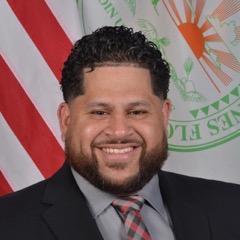 Jonathan BonillaAssistant City Manager · City of Pembroke Pines